Investment Interactives
Below are some interactive visualisations we have crafted. Acquaint more with the various aspects of our portfolios.
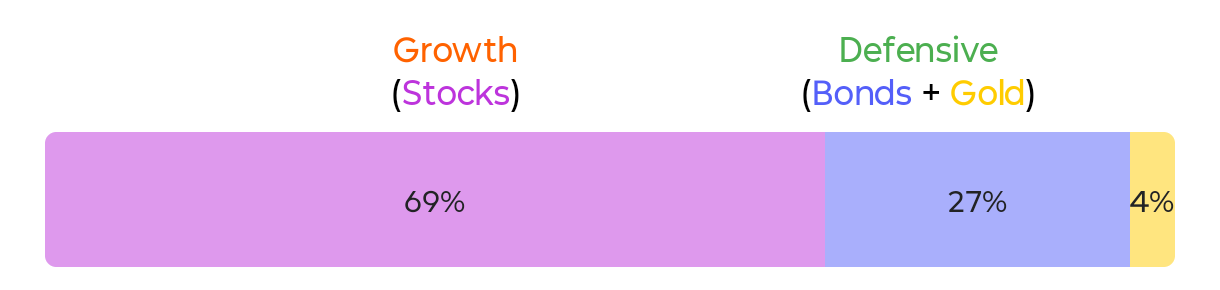
Growth vs Defensive
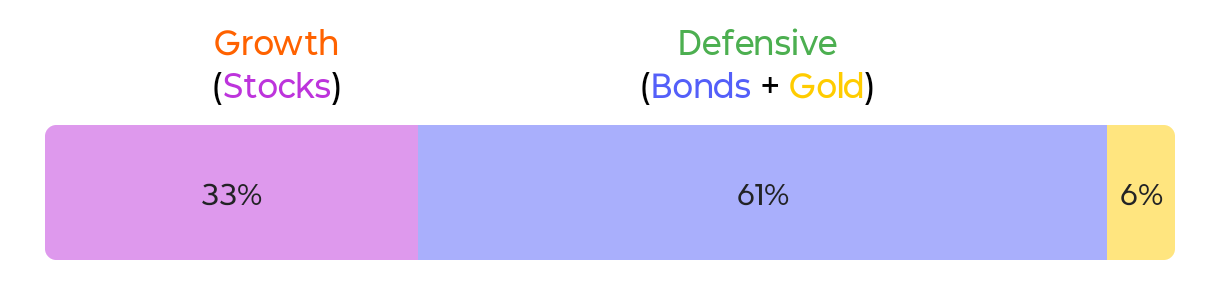
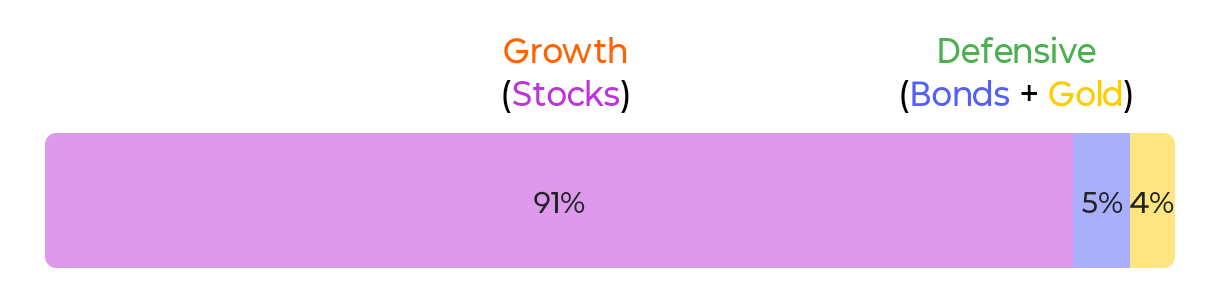
Current allocation in target portfolio 1 / 5
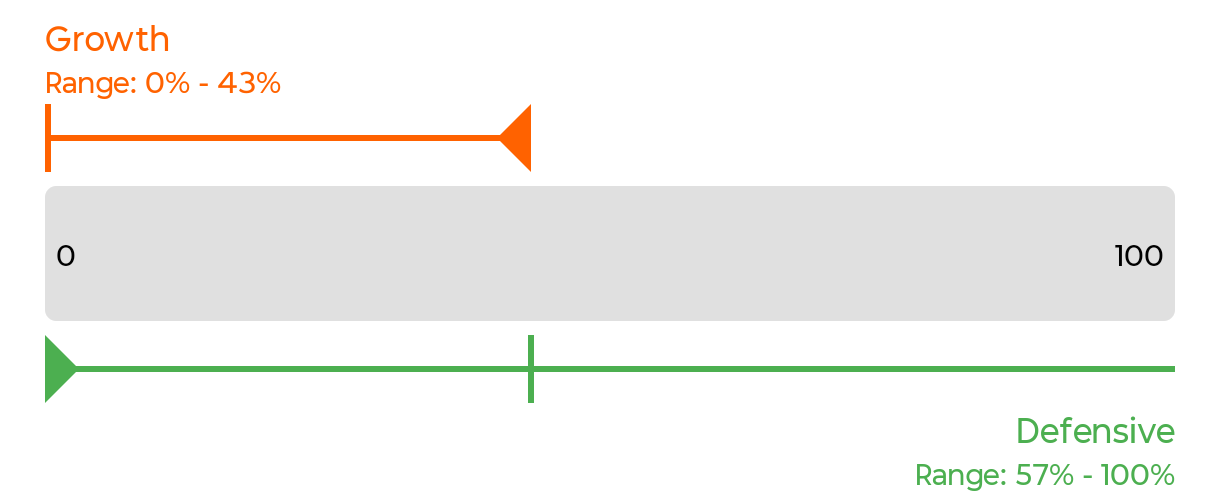
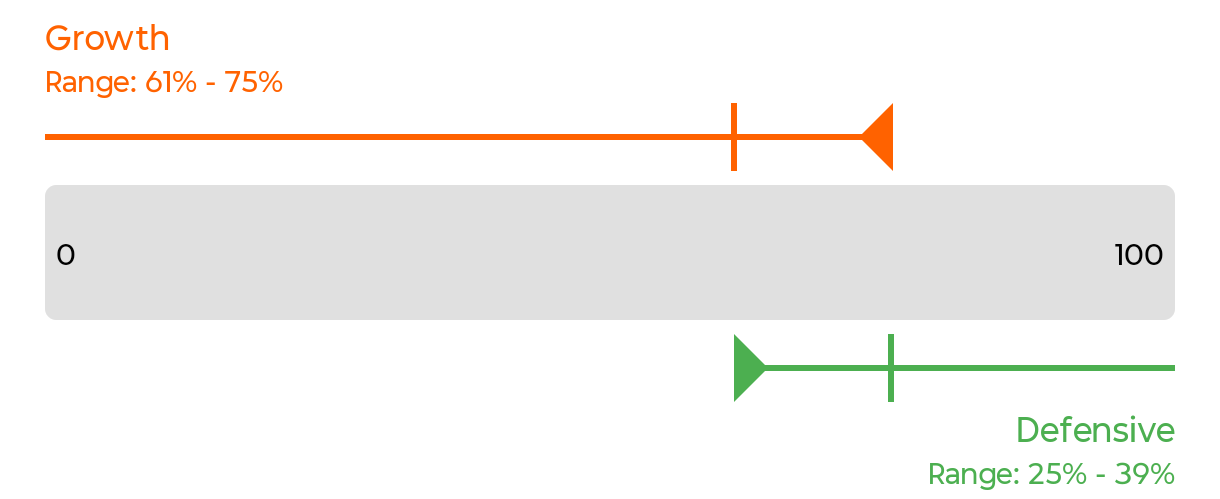
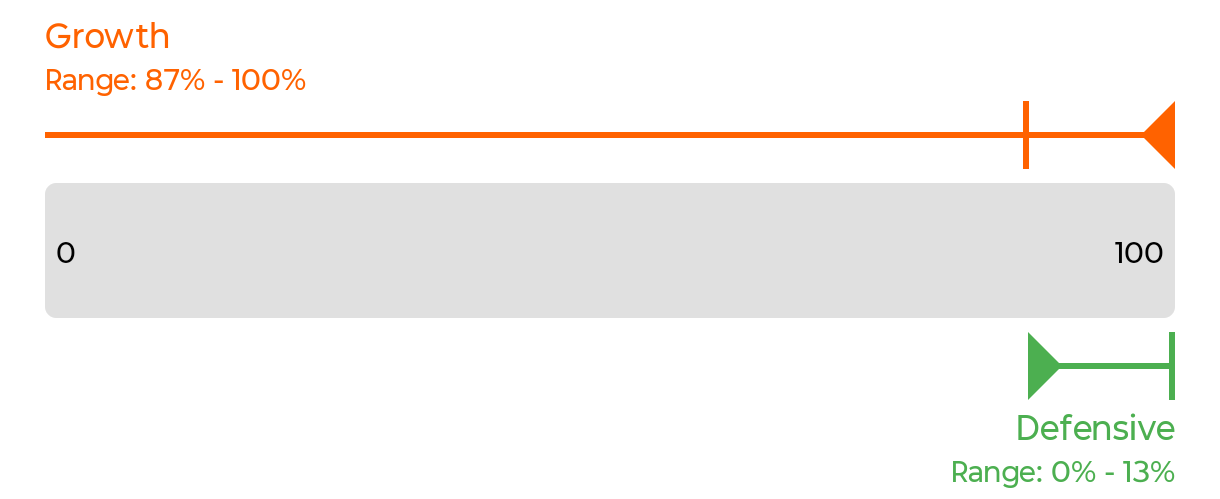
Allocation range in target portfolio 1 / 5
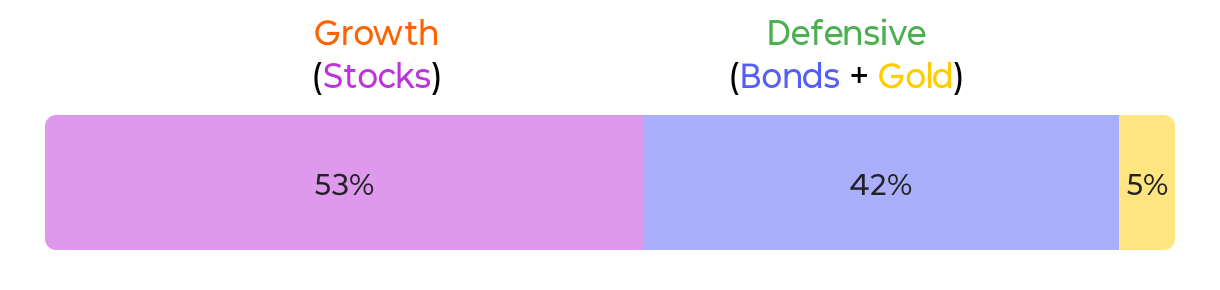
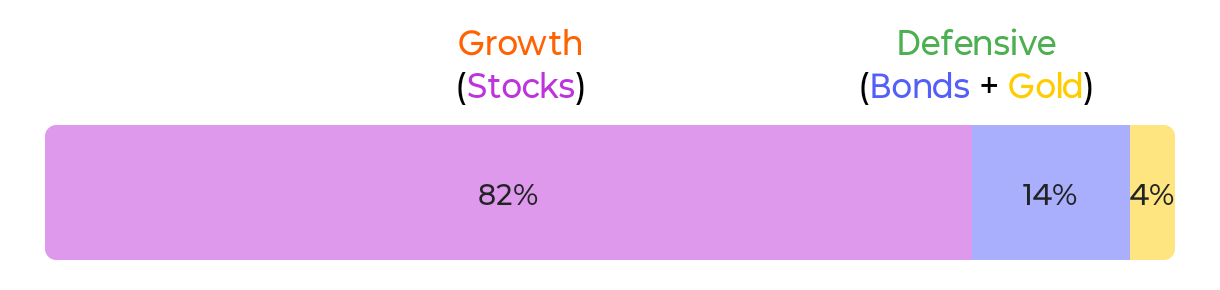
Current allocation in target portfolio 2 / 5
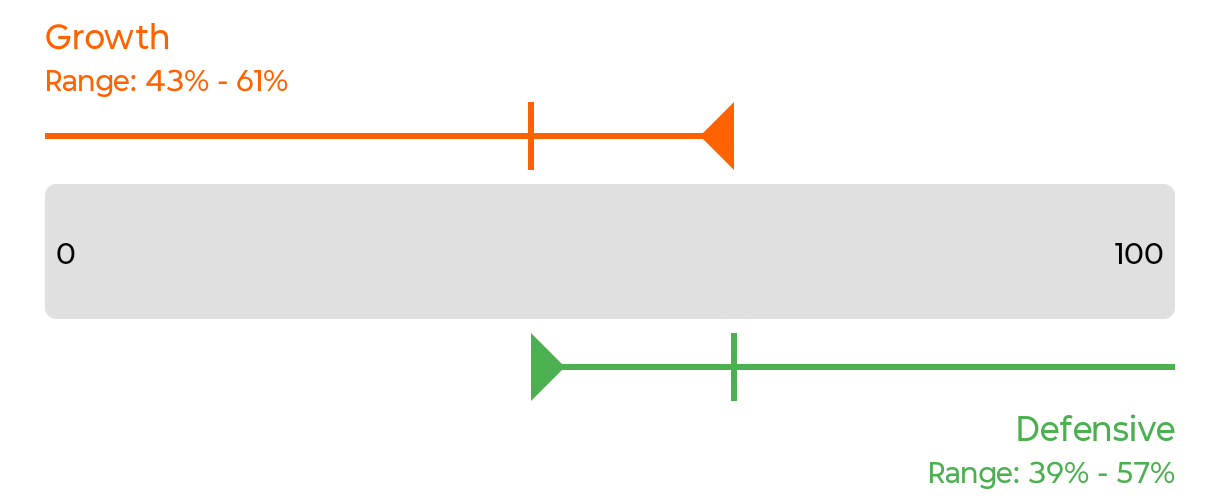
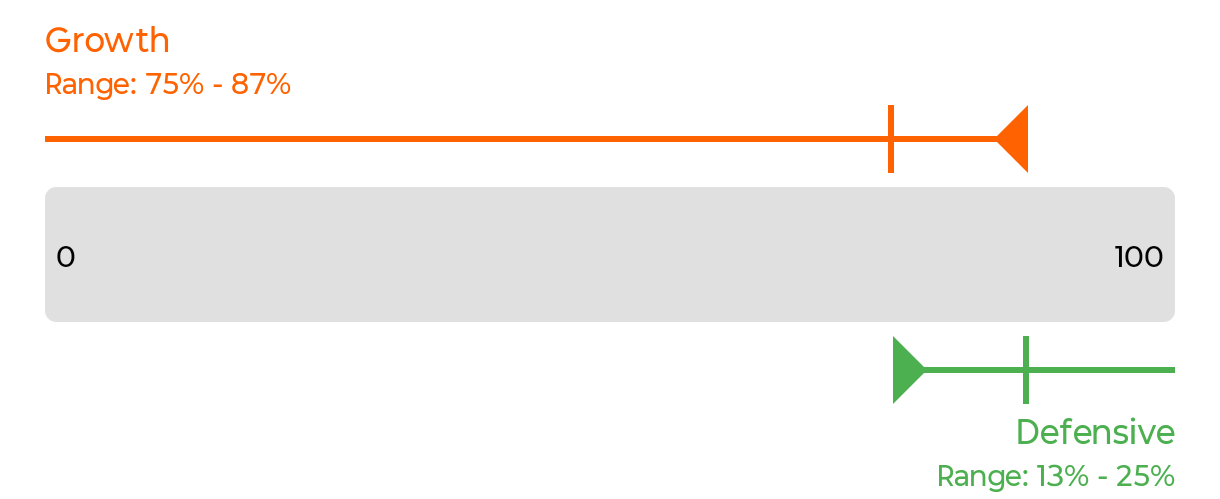
Allocation range in target portfolio 2 / 5
Current allocation in target portfolio 3 / 5
Allocation range in target portfolio 3 / 5
Current allocation in target portfolio 4 / 5
Allocation range in target portfolio 4 / 5
Current allocation in target portfolio 5 / 5
Allocation range in target portfolio 5 / 5
Note: The actual allocation in a client portfolio might vary from that in the target portfolio, mainly because (a) the client portfolio comprises whole units of securities; and (b) of day-to-day changes in the price of those securities.
QuietGrowth Portfolios span multiple countries
- Asia ex-Japan: Asia region excluding Japan.
- Data is as of 14-Jan-2016.
- Data procured from ETF providers.
QuietGrowth Portfolios span multiple industries
Formula: Shares 33% + Bonds 61% + Natural Resources 6% = 100%
- Data is as of 14-Jan-2016.
- Data procured from ETF providers.